

RQA Indicator Spotlight: Cutting to the Chase - The Fed’s Rate Reduction and What It Means
Rate cuts are back, and they’re already sending ripples through the financial world. With a 50 basis point reduction, the Fed has signaled that it’s ready to shift gears—but what happens next is where the real story begins. The bond market is now suggesting that rates could continue to decline rapidly, with projections of another 250 basis points in cuts over the next year. Interestingly, the market's implied rate cut path is even more optimistic than the Fed’s own guidance, indicating that market participants expect a quicker and deeper rate cut cycle than the Fed has signaled through its dot plot.
The graphic below illustrates the historical fed funds rate alongside the market's implied rate trajectory through January 2027, giving us a clearer picture of where rates might be headed.
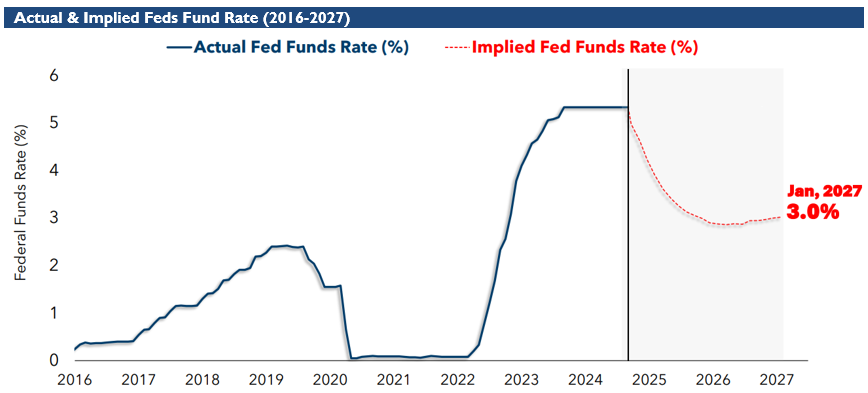
Sources: Bloomberg Finance L.P.; Ritholtz Wealth Management
The Double-Edged Sword of Rate Cuts
Historically, the start of a rate-cut cycle can be both a blessing and a curse for markets. Risk assets like the S&P 500 often rally initially as financial conditions ease. However, the outlook largely depends on the trajectory of economic fundamentals—whether they improve or continue to deteriorate. While rate cuts can provide a tailwind for markets, they also often signal underlying concerns about slowing growth. As a result, investors should prepare for a period of heightened volatility as markets adjust to the new reality.
Historical Context: Rate Cuts & Risk Asset Returns
To provide additional context, let’s look at what previous rate cut cycles have meant for risk asset returns. Using the S&P 500 as a proxy, the table below examines 18 rate cut cycles, identifying whether a recession followed the start of the rate cut cycle and what the subsequent 12-month return and maximum drawdown looked like after each occurrence.
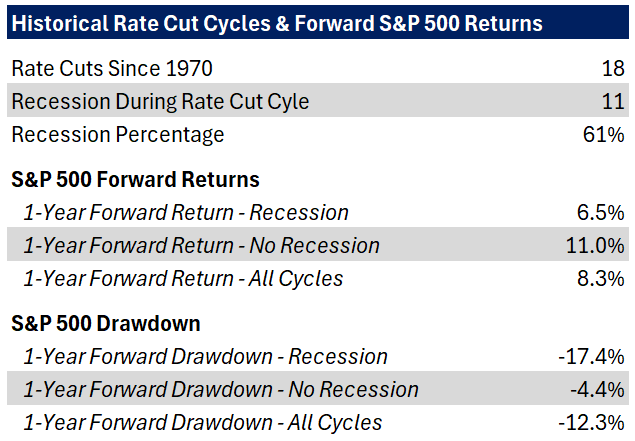
Sources: Federal Reserve, Bloomberg Finance L.P., Ritholtz Wealth Management & RQA
Recession Probability and Market Behavior
As shown in the table, a recession followed the start of a rate cut cycle in 11 out of 18 instances, or 61% of the time. When a recession does follow, as expected, the 12-month returns following the first rate cut are generally lower, while overall risk (measured by drawdowns) tends to increase. On the other hand, when a rate cut is not accompanied by a recession, the 12-month returns are generally higher, and the associated risk is lower.
Key Takeaways: A Nuanced View of Rate Cuts
The analysis highlights that while historical data provides useful insights, it should not be viewed as a binary guide for risk-on or risk-off decisions. Although the more recent rate cut cycles (notably in 2000 and 2007) preceded bear markets, the data shows that this is not always the case. A rate cut does not necessarily signal the onset of a recession or a market downturn. However, it does suggest that the probability of a recession increases in the near term. The Fed, which relies on forward-looking data, typically begins cutting rates when it sees signs of softer economic conditions in its forecasts and seeks to ease those conditions through the fed funds rate.
Looking Ahead: Balancing Risks & Opportunities
As we move into Q4, risk assets continue to look beyond a potential economic slowdown and have responded favorably to the larger-than-expected interest rate cut. The key question for markets moving forward is the delicate balance between how much the economy will "cool" and how effectively the Fed can mitigate that cooling through additional rate cuts. The outcome will likely depend on the extent of the economic slowdown versus the Fed's ability to stimulate growth with lower rates.
Economic Forecast Model
As of the end of August, the growth metric in Richmond Quantitative Advisors’ Economic Forecast Model stood at 0.24, up from July's 0.20—our first positive shift after several months of declines. While it remains below the revised figures from June and May, this slight improvement indicates that the economy may be stabilizing. Our model frequently oscillates around the neutral line, so it's essential to focus on significant shifts—particularly those that dip below zero, which can signal broader economic stress.
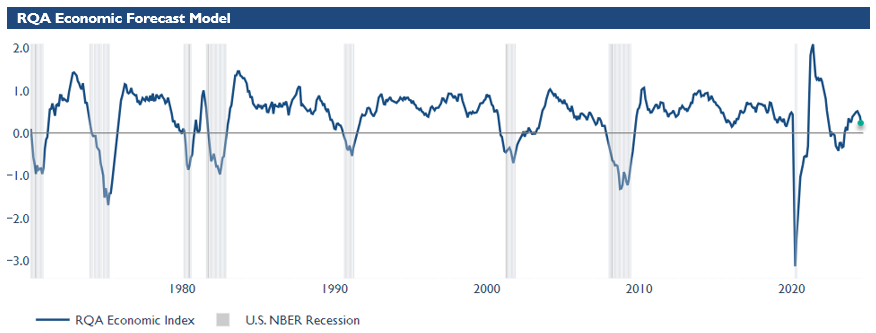
Source: Analysis by RQA. Data from U.S. Federal Reserve; Bureau of Labor Statistics; Norgate Premium Data; Institute for Supply Management.
The RQA Economic Forecast Model represents a consolidated composite of key economic leading indicators and market-based explanatory variables. The goal of this composite model is to present a holistic measure of primary U.S. economic growth drivers and their trends over time. (Additional detail on the model’s construction is provided here.)
Values above the zero-line are indicative of positive U.S. economic growth expectations in the near-term, and therefore, indicate economic strength and lesser chance of recessionary pressure. On the other hand, values below the zero-line represent the opposite - a more negative outlook and more elevated probabilities of the U.S. experiencing an economic contraction.
TAKING A CLOSER LOOK AT THE ECONOMIC DRIVERS
The RQA heat map of economic drivers provides additional insight into the U.S. growth outlook. By examining trends across sectors—such as labor, industrial activity, and financial conditions—we gain a more detailed understanding of the economy's health and trajectory. This breakdown helps us anticipate potential shifts in growth expectations and inflation trends.
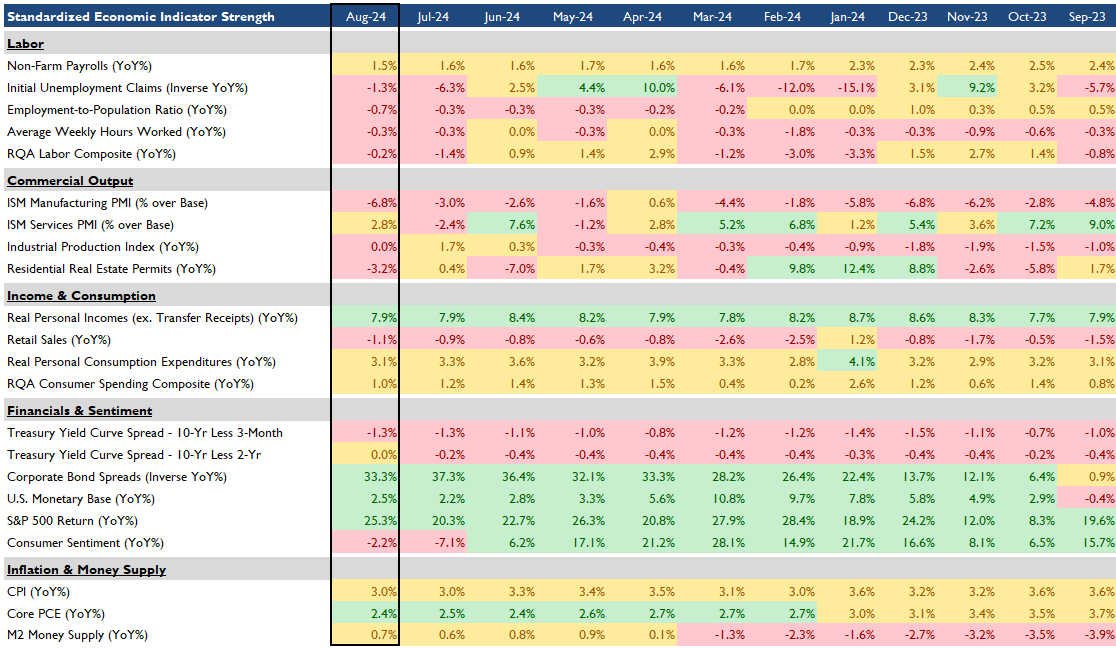
Source: Analysis by RQA. Data from U.S. Federal Reserve; Bureau of Labor Statistics; Norgate Premium Data; Institute for Supply Management.
Recent economic data reflects a mix of trends across sectors. The labor market shows signs of stabilizing, with job losses easing and slight improvements in employment conditions. However, volatility remains evident.
Commercial output remains in contrast, with manufacturing continuing to face challenges, while the services sector shows resilience. Industrial activity growth has slowed, signaling potential headwinds for production. Income and consumption trends have held steady, though retail sales continue to decline slightly, highlighting ongoing consumer caution. Spending levels remain relatively stable but show some signs of weakening.
Financial indicators reflect shifting investor expectations. The treasury yield curve is un-inverting, suggesting possible changes in outlook for future economic conditions. Corporate credit conditions have eased, and equity markets remain strong, continuing to perform well. Inflation remains stable, with prices showing little movement in recent months. Both the CPI and underlying inflation measures have moderated, indicating that inflationary pressures may be stabilizing.
MARKET REGIME DISCUSSION
As we close out the quarter, risk assets have generally posted positive returns, despite experiencing some bouts of volatility along the way. The initial rate cuts by the Fed were well received, with equity prices continuing to rise while bond prices corrected slightly following the announcement.
Equities: Broadening the Rally
On the risk asset side, the key focus now will be whether the rally can broaden beyond large-cap tech and see increased participation from other companies and sectors. Recently, small- and mid-cap companies, along with REITs, have seen gains, largely driven by the decline in interest rates. The utility sector has also been a standout, reaching all-time highs, primarily due to the forecasted increase in energy demand from the rapid expansion of data centers.
Fixed Income: Watching the Yield Curve
On the fixed income front, medium- and longer-dated bonds rallied strongly ahead of the Fed’s rate cut announcement but have since retraced some of those gains. The key question moving forward is whether the initial move down in rates was merely front-running a larger-than-expected rate cut, or if the post-meeting increase in rates signals a normalization process that could lead to a steepening of the yield curve. Keeping a close eye on the 10-year yield will provide crucial insights into the direction of the bond market from here.
Economic Growth: A Modest Rebound
On the economic growth front, the RQA forecast model saw a modest bounce after three consecutive months of negative readings. This kind of noise is expected, and as long as we remain range-bound or slightly positive, concerns over a sharp near-term contraction should be mitigated.
Economic Quadrant Update: Inflationary Boom
As for our economic quadrant output, with both inflation and growth rates declining, our regime model currently places us in the "inflationary boom" quadrant. However, we are hovering close to the zero bound for both inflation and economic growth, suggesting that the current regime is delicate and could shift depending on forthcoming data.
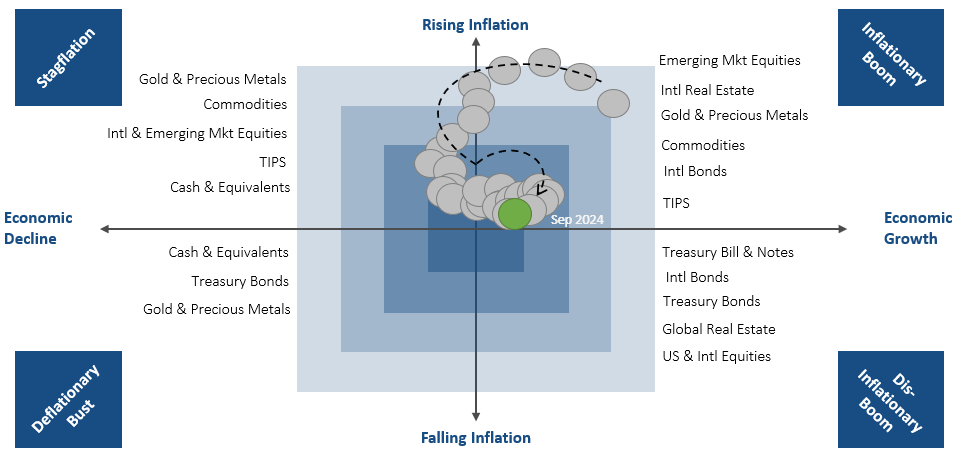
Source: RQA.