

RQA Indicator Spotlight: u.s. labor market
As we approach the end of the rate hiking cycle and anticipate the potential for rate cuts at the September Fed meeting, the ongoing stability within the labor market will come into sharper focus. Historically, rate cuts have often been implemented when the economy begins to slow significantly, with such contractions typically being felt within the labor market. In examining the current state of the U.S. labor market, two key indicators provide valuable insights: total job openings and non-farm payrolls. These data sets reveal the recent trends and dynamics of labor demand and supply, offering a glimpse into the broader economic implications.
Source: U.S. Department of Labor, JOLTS, BLS, Factset, J.P. Morgan
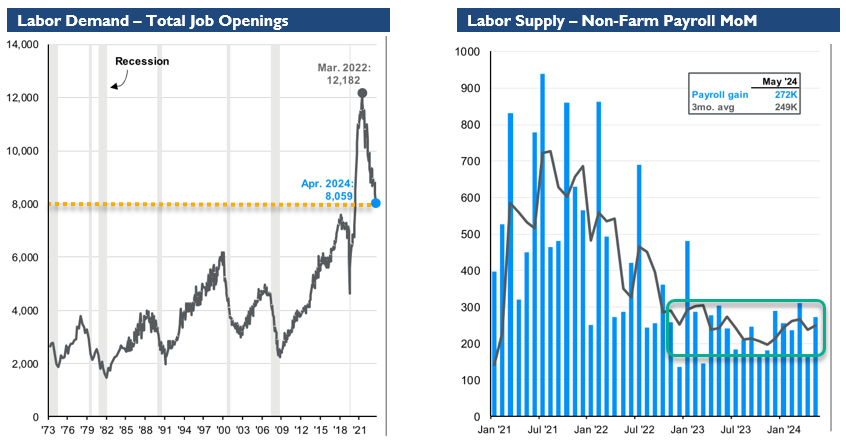
Labor Demand – Total Job Openings
The chart on the left illustrates the trend in total job openings from 1973 through April 2024. The data shows significant fluctuations over the decades, with notable drops during recessions. A peak was observed in March 2022 at 12,000 job openings. However, since then, there has been a downward trend, reaching 8,000 job openings in April 2024. This decline indicates a cooling in labor demand, potentially reflecting economic uncertainty or a shift in business hiring practices. This trend of decreasing job openings could signify that employers are becoming more cautious, possibly due to anticipated economic slowdowns or challenges in the broader economy.
Labor Supply – Non-Farm Payroll MoM
The chart on the right tracks the month-over-month changes in non-farm payrolls from January 2021 to May 2024. The data highlights significant variability in payroll gains, with peaks around mid-2021 and a general downward trend thereafter. Recently, from early 2023 onwards, there is a stabilization in payroll gains, with a three-month average of 249,000 jobs and a payroll gain of 272,000 jobs in May 2024. The green rectangle highlights this recent stabilization phase, suggesting a consistent but moderate increase in labor supply. This steady payroll growth indicates a resilient labor market, where employment opportunities continue to expand at a sustainable rate despite broader economic challenges.
Additional key labor trends
The first supplemental chart below provides a perspective on labor force growth from January 2008 to December 2023, distinguishing between foreign-born and native-born workers. The chart highlights the fluctuations in labor force growth, with notable declines during the COVID-19 pandemic. Particularly, the sharp drop in 2020 reflects the immediate impact of the pandemic. The subsequent recovery phase shows an increase in labor force participation, with foreign-born workers playing a significant role in the growth from 2021 to 2023. This indicates the importance of immigration in sustaining and expanding the labor force, which is crucial for economic growth and addressing labor shortages.

Source: BLS, Factset, J.P. Morgan
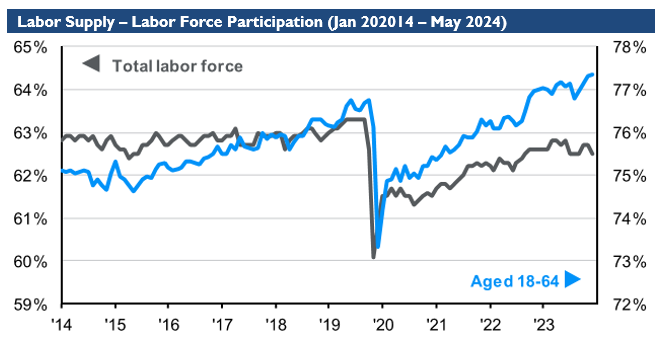
The second supplemental chart (presented below) shows labor force participation rates from January 2014 to May 2024. The blue line represents the total labor force, while the gray line focuses on the labor force aged 18-64. The data demonstrates a steady participation rate up until early 2020, followed by a sharp decline due to the COVID-19 pandemic. Since mid-2020, there has been a gradual and sustained recovery in participation rates, with both metrics reaching and surpassing pre-pandemic levels by 2023. Notably, the younger employment segment (aged 18-64) has shown an increase to new high participation rates, while the overall rates have not reached new highs. This discrepancy suggests that individuals aged 65 and older have not re-entered the labor market at the same rate, possibly due to early retirements or health concerns. This recovery signifies the labor market's resilience and the gradual return of younger individuals to the workforce, which supports economic stability and growth.
Source: BLS, Factset, J.P. Morgan
Implications for the Broader Economy
The trends in these charts offer important insights into U.S. labor market dynamics. The reduction in job openings suggests a potential softening of labor demand, which might lead to slower wage growth and reduced consumer spending power. On the other hand, the steady growth in non-farm payrolls indicates that the labor supply remains robust, contributing positively to overall economic stability. The increasing labor force growth, particularly among foreign-born workers, highlights the critical role of immigration in bolstering the workforce. Additionally, the recovery in labor force participation rates underscores the labor market's adaptability and strength.
Together, these trends suggest a balancing act in the labor market, where demand and supply are adjusting to new economic realities. This equilibrium, if maintained, could lead to a more stable economic environment, albeit with slower growth compared to the rapid post-pandemic recovery period. Measuring this overall labor growth profile against the backdrop of an anticipated decline in interest rates will be an important gauge of overall U.S. economic health.
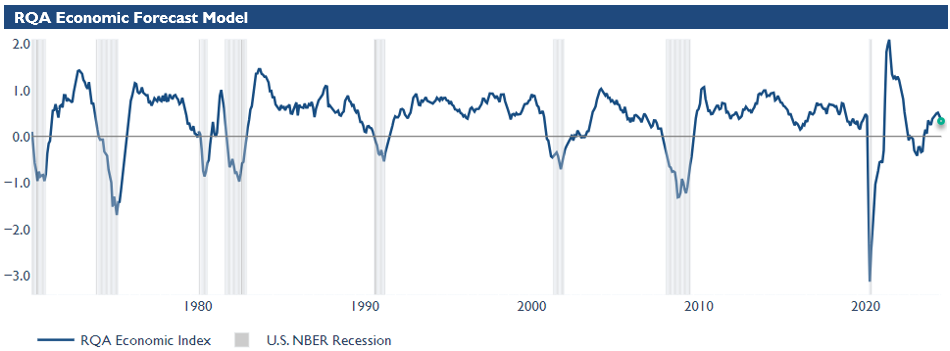
Economic Forecast Model
As of the end of June, the RQA Economic Forecast Model output adjusted down to 0.38 from 0.43 the previous month. This shift was largely driven by a softer labor market and marks the second consecutive month of decelerating output from the model.
As the rate of forecasted growth from the economic model adjusts lower, it is important to focus on where growth is waning for additional insight. Tracking these near-term shifts helps shape the overall health snapshot of the U.S. economy. Continued movements back to the low or no-growth zero bound should be treated as cautionary.
Source: Analysis by RQA. Data from U.S. Federal Reserve; Bureau of Labor Statistics; Norgate Premium Data; Institute for Supply Management.
The RQA Economic Forecast Model represents a consolidated composite of key economic leading indicators and market-based explanatory variables. The goal of this composite model is to present a holistic measure of primary U.S. economic growth drivers and their trends over time. (Additional detail on the model’s construction is provided here.)
Values above the zero-line are indicative of positive U.S. economic growth expectations in the near-term, and therefore, indicate economic strength and lesser chance of recessionary pressure. On the other hand, values below the zero-line represent the opposite - a more negative outlook and more elevated probabilities of the U.S. experiencing an economic contraction.
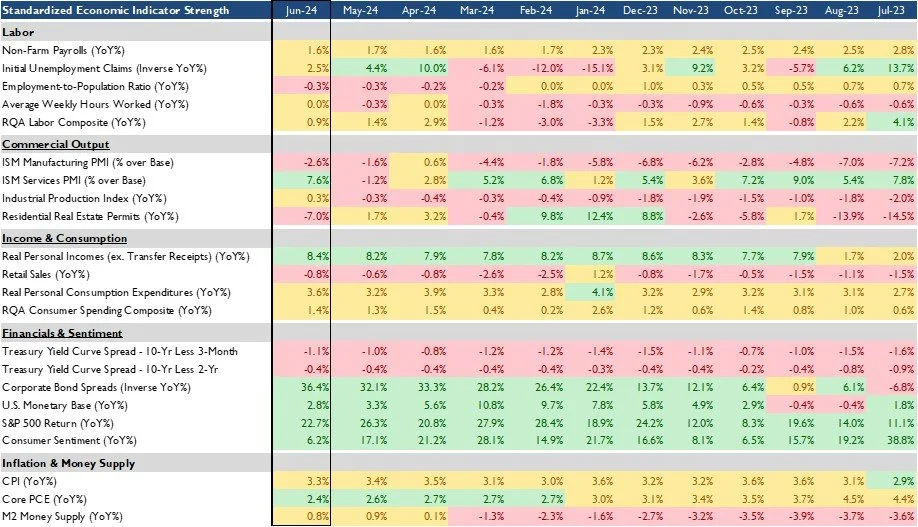
TAKING A CLOSER LOOK AT THE ECONOMIC DRIVERS
In the economic heatmap below, we are able to peak under the hood at a wide mix of underlying growth drivers in the U.S. economy. By reviewing this underlying data in more detail, we are better able to see how the underlying components of the U.S. economic growth picture are behaving through time. The indicators presented below have each proven to have predictive qualities in estimating the future direction of U.S. economic growth.
Source: Analysis by RQA. Data from U.S. Federal Reserve; Bureau of Labor Statistics; Norgate Premium Data; Institute for Supply Management.
In the last few months, the U.S. economy has experienced several notable shifts. Per the above discussion, overall demand within the labor market has been contracting while supply has reduced but remained at stable levels. The more recent statistics illustrate this ebb and flow and overall slowdown in job growth (Non-Farm Payrolls decreasing from 1.7% in May to 1.6% in June). and a significant reduction in layoffs (Initial Unemployment Claims declining from 10.0% in April to 2.5% in June). These trends suggest a slightly weakening labor market, but with fewer layoffs, indicating a complex employment landscape.
The manufacturing sector continues to contract, as evidenced by the ISM Manufacturing PMI decreasing from -1.6% in May to -2.6% in June. In contrast, the services sector has seen some volatile shifts, with the ISM Services PMI improving from -1.2% in May to 7.6% in June. This divergence highlights the differing conditions across various sectors of the economy, with services experiencing a more favorable environment compared to manufacturing.
Financial indicators present a nuanced to stable picture. Credit conditions appear to be easing, as reflected by tighter corporate bond spreads (Inverse spreads YoY% increasing from 32.1% in May to 36.4% in June). Equity market returns have moderated but remain positive YoY (S&P 500 Return year over year change of 22.7% in June). Consumer confidence, however, has slowed in recent months.
Additionally, inflation continues to moderate, with the CPI decreasing slightly from 3.4% in May to 3.3% in June and core PCE falling from 2.6% in May to 2.4% in June. These shifts suggest an economy facing mixed signals, with some areas of strength but also significant challenges, particularly in financial sentiment and consumer confidence, heading into the second half of the year.
MARKET REGIME DISCUSSION
As severe uncertainties have sharply increased across the political landscape in the U.S., market angst has risen, as represented by overall volatility within risk assets. While overall asset classes have experienced moderate fluctuations, movements within sectors and factors have reached significant levels, often described as 3-4 sigma events. The most notable shifts have been from large-cap tech to small-cap equity. Time will tell if we are witnessing a release of pent-up energy leading to a healthier market rotation and a broadening out of the rally, or if these are merely signs of additional volatility within risk assets heading into the back half of the year.
This uptick in volatility comes against a backdrop of the market now pricing in a greater than 90% chance of the first rate cut at the September Fed meeting. This increase in probability can be attributed to continued subdued readings on the inflation front, along with some softness in macroeconomic indicators. The market expects Fed officials to reconfirm this anticipated rate path at their meeting this week.
On the economic growth front, the RQA forecast model has declined for the second month in a row lead by a softer labor market and some deceleration within the financial and consumer sentiment segment. Keeping an eye on the this overall trend will be crucial as we head into what looks like the start of a Fed cutting cycle.
Regarding the economic quadrant output, as the change in inflation and growth shift down, we find the regime model sitting within the inflationary boom quadrant, but migrating back toward the zero bound (both in terms of inflation as well as economic growth).
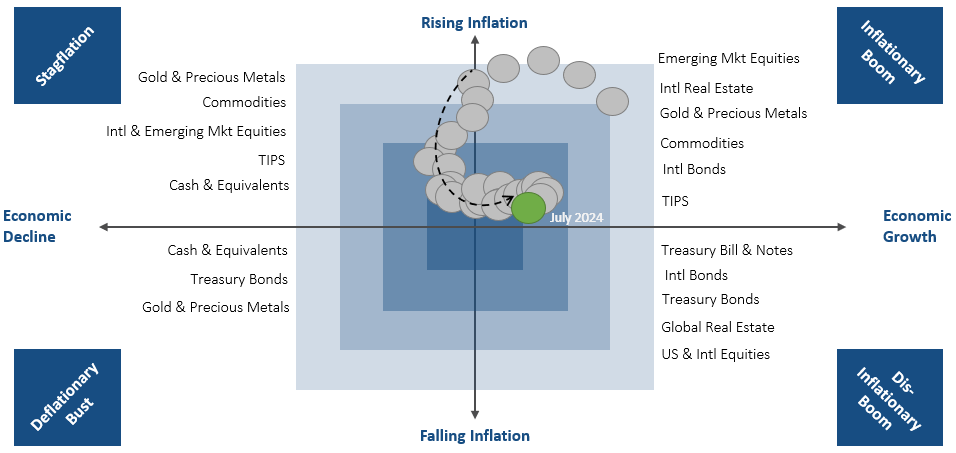
Source: RQA.