

RQA Indicator Spotlight: Corporate Bond Spreads Narrow
In this month's analysis of economic data, we delve into the historical trends of corporate bond credit spreads. These spreads, indicating the yield differential between AAA and BAA corporate bonds, offer crucial insights into investor sentiment and economic landscapes.
A widening credit spread, characterized by rising BAA yields relative to AAA yields, signifies heightened risk perception in the corporate bond market. This phenomenon often foreshadows economic downturns, making it a pivotal indicator for investors. Conversely, a narrowing credit spread reflects optimism and confidence in corporate financial health. In the graphic below, we illustrate the historical corporate bond spread and overlay prior recessionary periods for the U.S. economy.

Source: U.S. Federal Reserve, Analysis by RQA
In the past two years, amidst rising and sustained interest rates, corporate spreads have remained relatively stable, even narrowing in recent months. This trend has surprised some market participants, whom anticipated a more pronounced slowdown due to tighter monetary conditions, particularly impacting companies with riskier credit profiles.
Contrary to expectations, however, economic conditions have shown resilience, with default rates remaining historically low. This has bolstered risk-taking appetites in the higher-risk credit segment. Moreover, the absolute yield levels have remained attractive for fixed-income investors, especially as rates have settled in the mid-to-high single digits, attracting demand from alternative asset classes like equities.
Yet, as corporate spreads continue to narrow, it's imperative to evaluate the premium offered relative to historical norms. Narrowing spreads imply diminishing yield compensation for assuming credit risk. While this may initially benefit credit markets and investor performance as high yield bonds get priced higher, it's essential to recognize the lower return profile vs. the risk free alternative. Investing in risky credit when spreads are at their tightest may not offer a favorable risk-reward tradeoff. As depicted in the graphic below, as spreads approach historical lows, the potential excess yield may no longer justify the increased risk exposure going forward.

Source: U.S. Federal Reserve, Analysis by RQA
In conclusion, the ongoing trend of narrowing corporate bond spreads continues to signal confidence and stability in the bond market, despite a backdrop of moderating U.S. economic growth and expectations for sustained higher interest rates. As earnings reports and economic indicators unfold, it will be essential to monitor the positioning of these spreads across different issuers to gauge any emerging stress in the system.
Additionally, as spreads continue to tighten, it is imperative to assess the extent of additional yield-seeking behavior along the credit risk spectrum. This evaluation will better prepare investors for potential spread widening in the future.
Economic Forecast Model
In March, the RQA Economic Forecast Model exhibited a noticeable uptick, climbing from 0.47 to 0.49 compared to the previous month. This sustained upward trajectory in the model's data strengthens our confidence in the robust momentum driving the underlying U.S. economy in the short-term.
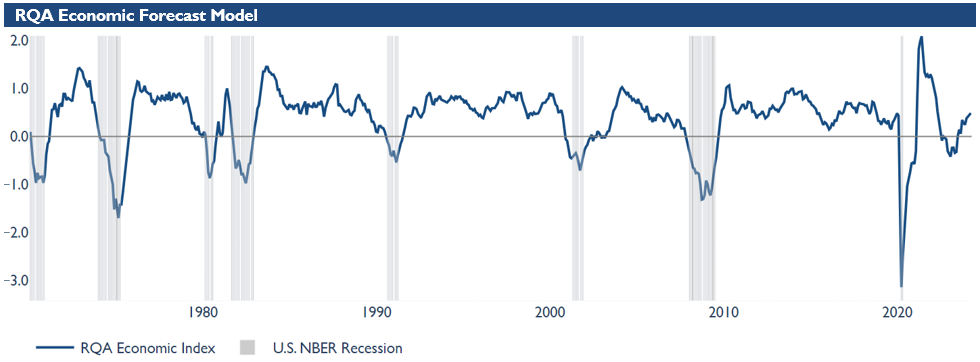
Source: Analysis by RQA. Data from U.S. Federal Reserve; Bureau of Labor Statistics; Norgate Premium Data; Institute for Supply Management
The RQA Economic Forecast Model represents a consolidated composite of key economic leading indicators and market-based explanatory variables. The goal of this composite model is to present a holistic measure of primary U.S. economic growth drivers and their trends over time. (Additional detail on the model’s construction is provided here.)
Values above the zero-line are indicative of positive U.S. economic growth expectations in the near-term, and therefore, indicate economic strength and lesser chance of recessionary pressure. On the other hand, values below the zero-line represent the opposite - a more negative outlook and more elevated probabilities of the U.S. experiencing an economic contraction.
TAKING A CLOSER LOOK AT THE ECONOMIC DRIVERS
In the economic heatmap below, we are able to peak under the hood at a wide mix of underlying growth drivers in the U.S. economy. By reviewing this underlying data in more detail, we are better able to see how the underlying components of the U.S. economic growth picture are behaving through time. The indicators presented below have each proven to have predictive qualities in estimating the future direction of U.S. economic growth.

Source: Analysis by RQA. Data from U.S. Federal Reserve; Bureau of Labor Statistics; Norgate Premium Data; Institute for Supply Management
The most recent insights from our leading indicator dataset depict a U.S. economy that seems to be stabilized and growing on balance, albeit with some mixed signals.
While measures of nominal employment remain steady and within a healthy range, indicating resilience in the job market, there are indications of ongoing decreases in average weekly hours, declining momentum in non-farm payrolls, and slight upticks in unemployment claims. It’s important to note that while the annual growth rates in these measures continue to fall, we certainly remain well within the healthy historical range in absolute terms for each - meaning, the recent trends are noted, but not any real reason for caution just yet.
Looking at the industrial and manufacturing sectors in the U.S., we continue to witness a steady decline, in contrast to a buoyant services sector. Additionally, recent months have seen a surge in permits in the residential real estate market, except for the slight dip initially reported in March, suggesting future construction activity and potential economic expansion remains underway.
Consumer sentiment remains positive, as indicated by rising incomes and increased spending, reflecting confidence in future economic prospects from the largest contributor to U.S. GDP - the U.S. consumer. Additionally, the robust performance of the stock market and narrowing credit spreads contrast with the ongoing inversion of the yield curve, highlighting short-term investor optimism alongside longer-term caution in the bond market.
Lastly, there remain to be some modest inflationary pressures as evidenced by CPI figures staying above 3%; however, PCE readings have recently dipped and stayed below 3.0% for back-to-back months now, providing some hope for easing inflationary pressures.
Overall, this array of indicators underscores an economy experiencing both growth and caution simultaneously, with consumer-driven sectors advancing while production sectors and inflation metrics continue to exhibit mixed signals that warrant careful monitoring.
MARKET REGIME DISCUSSION
As we approach the end of April 2024, the economic landscape reveals several significant developments. Inflation persists, displaying resilience with little change noted, particularly evident in the sustained multi-month gains seen in oil and other commodities.
Despite this persistent inflation, the labor market remains robust. March witnessed notable job growth as payrolls surged by 303,000, surpassing expectations. Private payrolls recorded a gain of 184,000, underscoring the labor market's resilience and maintaining strong momentum amidst challenges such as higher interest rates.
Initial projections for multiple rate cuts have shifted, now suggesting only one likely rate cut toward the latter part of the year. Given that the Federal Reserve often avoids major economic decisions before key election events, the window for targeted rate cuts this year has narrowed, aligning with adjusted expectations.
GDP growth in Q1 2024 fell below expectations, expanding at an annual rate of 1.6% according to advance estimates. This figure represents a significant slowdown from the 3.4% growth rate observed in Q4 2023. Despite these fluctuations, the economic landscape remains firmly positioned within the "inflationary boom" quadrant. Risk assets have demonstrated outperformance in Q1, and heightened demand has been observed for commodities and gold.

Source: RQA.