

Some market participants have referred to the stock market as analogous to that of a casino and suggest the market being akin to legalized gambling. While we don’t think those parallels are necessarily warranted, we do think there are substantial overlaps between a public market and games of risk within a casino, particularly as it relates to gaining an edge. In this post, we will take a walk down the path of risk vs. reward as it relates to gaining a small edge using one of the most popular casino games in history – blackjack.
As a backdrop for this post, I can recall one of my first trips to Vegas and reading through the gauntlet of some of the most popular books that claimed to teach the “secrets to winning money in Vegas”. One of the all-time classics in this genre is Beat the Dealer: A Winning Strategy for the Game of Twenty One written in 1962 by Edward Thorp. The book provides granular detail into how one can utilize card counting techniques in order to gain an edge when playing blackjack in a standard casino. Thorp, who actually went on to be a revered investor, was one of the first to use the strategy of counting cards to effectively gain a small mathematical edge over the house. And, when this small edge was present, a player could increase the size of his or her bets to best exploit their edge against the dealer.
While counting cards is not necessarily an easy task (especially given the rules and number of decks used in today’s blackjack games), having the ability to achieve a very small edge against the house can have enormous benefits, particularly if applied consistently over many hands and over long periods of time. In what follows, we will take a look at a small edge as it relates to blackjack, its fragility, and ways to extract as much profit from the edge as possible. We will also explore how the framework of exploiting a small edge can and should be applied in the world of investing.
Basic Blackjack Strategy & Player Expectancy
When playing what is referred to as “basic strategy” in blackjack, one plays each hand in accordance with the highest probable outcome for the player – maximizing chances against the house. Playing with the basic strategy alone, however, still provides a player with negative 0.5-1.0% expectancy (i.e - for every $100 played, the house is expected to collect $0.50-$1.00 on average). This is unfortunate for the player and is why it’s a pretty safe bet to always try to be the house when playing such games. However, by utilizing card counting or “reading” techniques, one is actually able to tilt the odds in their favor, and player expectancy can turn positive by 1.0-2.5%. While this seems like a very small edge, we will explore how the exploitation of this edge can add up to a meaningful sum over time.
Taking a Look at a Small Edge by Simulating Blackjack Hands
Next, we will pretend to sit down at the blackjack table, simulate multiple hands given a small implied edge of 2% in our favor, and analyze the overall results from a capital return and risk perspective. Assuming we have a starting base capital account of $1,000 and bet on average $50 per hand, let’s take a look at our potential gains and losses after 100, 500, 1,000, and 5,000 hands of blackjack. Figures 1-a through 1-d show the results of these simulated blackjack hands and their effect on our overall account.
Figure 1: Profit & Loss Curves from Blackjack Simulation
Figure 1-a: 100 Hands
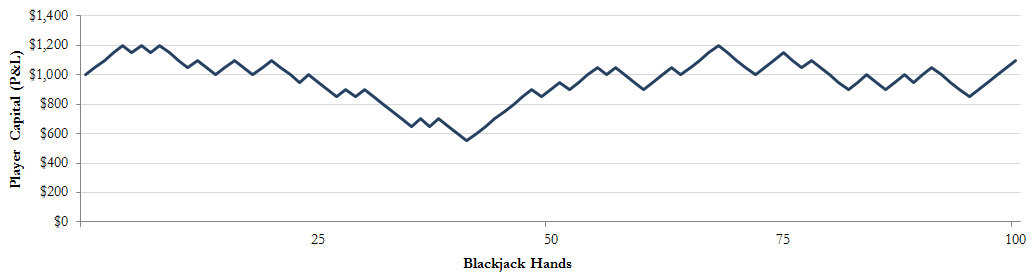
Figure 1-b: 500 Hands

Figure 1-c: 1,000 Hands

Figure 1-d: 5,000 Hands
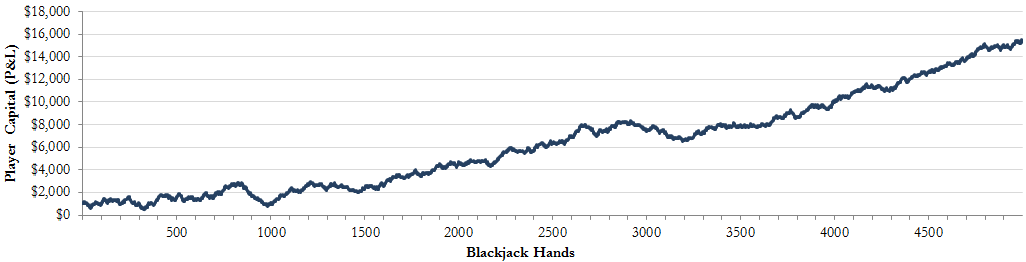
As we can see in the simulation, the small edge achieved playing blackjack was really not apparent in the first 100, 500 or even 1,000 simulated hands (Figures 1-a, 1-b & 1-c), but as we approached the 5,000th hand (Figure 1-d), the edge becomes very apparent, as our profits start to become substantial – growing from $1,000 to over $15,000 in this particular simulation run. To further analyze this blackjack simulation, we can take a look at the overall return and risk characteristics of our capital account over the full course of the 5,000 hands.
Figure 2: Return & Risk Metrics from Blackjack Simulation (5,000 hands)

As detailed in Figure 2, we can point to the substantial return achieved across the 5,000 simulated blackjack hands with just a 2% edge. On the risk side of the spectrum, it should be noted that swings of 20% of our account balance on average were experienced for every 100 hands played, and our maximum drawdown (i.e. max % loss of capital from any interim account peak) was 74% over the course of the full period. Given these risk metrics, it would likely have been a challenge for us to maintain full faith in our card counting abilities, as at one point our capital account would have declined by nearly three quarters!
Why do these unfavorable risk parameters exist? Well, it’s largely related to the very small edge we have. When deploying a small edge, simple chance always remains as a large part of each individual outcome – meaning streaks of both good and bad luck are likely to occur.
Maximizing the Edge by Betting on Multiple Players, Across Multiple Games
So what can be done to combat the fragility of a small edge and remove much of the potential for bad luck and losing streaks from the equation? What if we financially back multiple players in order to take advantage of multiple games at once. Effectively, we will become the “bank”, providing capital to five separate players, so that they can each extract his or her 2% edge. As the bank, our attention will then be focused on the overall gains and losses across all the players – i.e. the “Team Account” – as opposed to any player individually.
To analyze this concept further, we will re-run the 5,000 simulations for each of five individual players, and then compare their performance to our overall performance (which is the investment of $200 we make in each of the five players, totaling $1,000). By taking this approach, we can explore the outcomes associated with deploying multiple players across multiple games.
Figure 3: Blackjack Simulation (5,000 Hands) for Five Players & Team Account

Good news, our investment into each of our players exhibited strong positive returns, albeit some performed better than others. Figure 3 above details the account value paths and outcomes for our team of five blackjack players, each playing individual games for 5,000 hands, along with our Team Account, which invested equally across the five players. We can quickly point out that the individual players’ accounts took somewhat random and volatile paths and ended with very different dollar amounts. In analyzing the green line, however, which is our Team Account, we can note the smoothness and stability compared to the individual players. Figure 4 displays the return and risk metrics for each of the players along with the Team Account.
Figure 4: Return & Risk Metrics from Blackjack Simulation (Five Players & Team Account)

As detailed in Figure 4, we can note the return and risk metrics for the individual players is fairly inconsistent, with each having a wide range of outcomes. When compared to our Team Account or “portfolio of the five players” the return and risk metrics outperform significantly, particularly from a risk-adjusted return perspective. More specifically, the return per unit of risk per 100 hands for the Team Account is 1.63, a 70% improvement compared to the best player’s 0.96 and over double the team average of 0.68. Furthermore, our maximum drawdown or total loss from interim account peak was just 15% within our Team Account, whereas the individual players experienced maximum drawdowns ranging from 37%-85%.
As evidenced above, the Team Account provides tremendous benefits in terms of risk reduction compared to the average risk profile of the individual players. We can also note that by substantially reducing our risk through the Team Account, we could then consider borrowing half of our bankroll from the casino (i.e. leverage our account by 50%), and therefore, double our returns and still have a lower risk profile compared to that of the average of our five players. Diversification at work!
The Power of Diversifying Across Edges
So how did the Team Account outperform each of the individuals on a risk-adjusted basis? When we take the profit and loss paths (i.e. equity curves) from the individual players and combine them into a portfolio of multiple players playing multiple games, we are able to allocate our capital across multiple, uncorrelated bets - and as a result, reap substantial diversification benefits.
As each of our bets (individual players) are playing independent games, they win and lose at different times. Therefore, a losing streak for one player is likely to be partially offset by winning hands from the other players. This dynamic makes a well-balanced allocation across all the players a more optimal approach, as the volatility and drawdowns of a team portfolio are likely to be minimized, whereas the expected returns remain fully intact. In more mathematical terms, the profits and losses within each player’s account are uncorrelated to one another. As a result, our overall Team Account is able to average across the total return profile of the individuals, while sharply reducing the overall risk (i.e. volatility and drawdowns).
Essentially, we are maximizing our chances to succeed by diversifying across edges, and therefore, maximizing the overall edge we have by counting cards. This team approach is very much the same as what was deployed by the famous card counting students from MIT and Harvard.
The Blackjack Framework & Public Market Investing
While the investment world is quite a bit different from the blackjack table, the approach to capital allocation across asset classes and investment strategies should be thought about in a similar framework. The end goal for any investor or asset allocator is to maximize returns per unit of risk, while also avoiding large account drawdowns and the risk of ruin. Using Thorp’s blackjack mindset and applying the same framework to an investment portfolio, one has a substantial advantage in achieving a smoother, less stressful investment experience.
If we think of the blackjack example as simply maximizing our number of diversified bets across different games where we have a statistical edge, we can then apply the same concept to traditional investment approaches. The common portfolio of 60% stocks / 40% bonds (i.e. 60/40 portfolio - see analysis here and here) is a good example of passively playing two games to maximize your overall chances of success - however, we feel that this is only a decent first step, and material improvements can still be obtained.
Whether your favorite investing strategy is growth, value, momentum, quality, etc., it’s always important to remember it never hurts to continue diversifying across managers (multiple players) as well as strategies (multiple games). At RQA, we specialize in seeking to maximize edges as it relates to global assets and strategies, and we spend a significant amount of time carving out as many favorable blackjack games as possible.
To receive RQA Research and Updates, sign up with your email.
Disclaimer: These materials have been prepared solely for informational purposes and do not constitute a recommendation to make or dispose of any investment or engage in any particular investment strategy. These materials include general information and have not been tailored for any specific recipient or recipients. Information or data shown or used in these materials were obtained from sources believed to be reliable, but accuracy is not guaranteed. Furthermore, past results are not necessarily indicative of future results. The analyses presented are based on simulated or hypothetical performance that has certain inherent limitations. Simulated or hypothetical trading programs in general are also subject to the fact that they are designed with the benefit of hindsight.